![]()
![]()
 The need to visualize patterns in numbers evolved in conjunction with the development of civilization. Early civilizations like the Babylonians and Ancient Greeks noted patterns in the numbers themselves: For example, Pythagoras and his followers noted numbers that resulted from constructing various sized perfect squares with stones: 1, 4, 9, 16, ... They also constructed perfect triangles and noted the number of necessary stones: 1, 3, 6, 10, ... The Pythagoreans proposed that mathematics revealed the essence of the universe and found that the earth is a sphere which their observations confirmed. Plato taught that mathematics could be used to explain the universe. His student, Eudoxos, used the mathematics of geometric spheres to describe both the regular (star) and irregular (planet) motions in the heavens. Later Claudius Ptolemy used connected circles (deferents, epicycles, and equants) to add explanation of the variations in planet brightness.
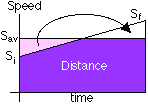
 As their society emerged from the Midevil period, some Europeans such as Robert Kilwardby (University of Paris and Oxford f1250) adopted mathematics as the tool for explaining physical phenomena. His disciple, Roger Bacon, singled out ignorance of mathematics as the cause for the universal decline of learning in the 13th century! Thomas Bradwardine (c. 1295-1349) tried to clarify the causes of change such as motion. He and other fellows at Merton College searched for geometric methods of visualizing and making mathematical patterns in speed and other properties that change. They began to draw bars and histograms of lengths proportional to successive measurements. Nicole Oresme of Paris used what today would be called graphs to quantify physical qualities such as speed, displacement, temperature, whiteness, and heaviness, but also nonphysical qualities such as love charity and grace. For example, he used the geometry of a graph to prove a uniformly accelerated object travels the same distance as it would, had it travelled steadily at the average (Sav) of its initial (Si) and final (Sf) speeds. (The area of the distance rectangle is equal to the area of the trapezoid because moving the pink triangle doesn't change its area.)
That search for patterns in the phenomena of our world continues with efforts such as Stephen Wolfram's A New Kind of Science in which he uses computers and a program called Mathematica to seek patterns in the apparent chaos of vast collections of related numbers.
Construct a histogram of the data provided in Table #1 below.
Consider the produce section at a grocery store. Vegetables are sorted with each veritable piled in a bin with others of the same kind. The more vegetables, the higher the pile. A quick glance can determine if the bin is nearly empty. A histogram is a similar arrangement of bins that allow the viewer to easily see if a bin is piled high or nearly empty.
| Title | Price | Title | Price | |
| Moulin Rouge | $23.85 | Back in U.S. Live | $20.05 | |
| $15.07 | $17.87 | |||
| $24.89 | $17.49 | |||
| $19.40 | $19.99 | |||
| Grease | $21.15 | Wizard of Oz | $20.52 | |
| $15.74 | $15.88 | |||
| $19.74 | $19.98 | |||
| $22.10 | $20.29 | |||
| $17.22 | $17.99 | |||
| $20.74 | $18.34 | |||
| Sound of Music | $18.00 | $21.23 | ||
| $23.99 | $18.99 |
![]()