![]()
![]()
It had been long noted that adding various chemicals to fire modifies the flame color. But not until long after Newton's synthesis of earthly and heavenly phenomena did astronomers connect starlight with chemical composition.
Christiaan Huygens (1629-1695) in Holland speculated that stars were but distant suns. He drilled a series of different diameter holes in a brass disk, viewed the sun through the holes, and attempted to match the brightness to his memory of the brightness of stars then calculated an estimate of the distance to nearest stars. Huygens did many things: Among them, he made improved telescopes, invented the pendulum clock to provide the accurate timings needed for astronomy, measure the size of another planet, speculate Venus is covered in clouds, drew pictures of the surface of Mars and determine its rotation period (roughly 24 hours), discovered the largest moon of Saturn and recognize the true nature of Saturn's rings (which Galileo had thought looked like ears).
William Wollaston (1766-1828), English physician and chemist, was one of the first to observe ultraviolet radiation. In 1802, he noted that the spectrum of sunlight did not appear to be a continuous band of colors, but rather had a series of 7 dark lines superimposed on it. Wollaston attributed the lines tonatural boundaries between colors.Joseph von Fraunhofer (1787-1826), employed in Joseph von Utzschneider's Optical Institute, examined the spectrum of solar light passing through a thin slit in 1813 and noticed a multitude of dark lines. These were missed by Isaac Newton during his study in 1666 because he shone light from the whole solar disk through a circular hole into his prisms. Realizing that these lines could be used as wavelength standards, Fraunhofer accurately measured the position of 324 of over 500 lines. Many of the brightest Fraunhofer lines retain the alphabetic designations he assigned. Over 25,000 such lines are now catalogued.
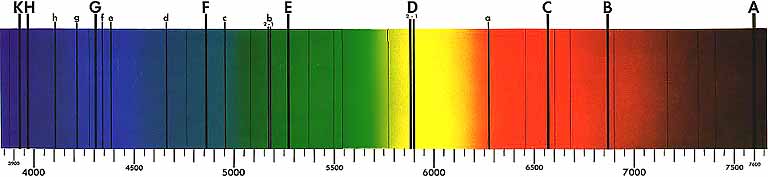
| Line | Caused by.. | Wavelength (Å) | Line | Caused by.. | Wavelength (Å) | |
| A | O2 | 7594-7621 | d | Fe | 4668 | |
| B | O2 | 6867-6884 | e | Fe | 4384 | |
| C | H | 6563 | f | H | 4340 | |
| a | O2 | 6276-6287 | G | Fe & Ca | 4308 | |
| D - 1, 2 | Na | 5896 & 5890 | g | Ca | 4227 | |
| E | Fe | 5270 | h | H | 4102 | |
| b - 1, 2 | Mg | 5184 & 5173 | H | Ca | 3968 | |
| c | Fe | 4958 | K | Ca | 3934 | |
| F | H | 4861 |
In 1864, Sir William Huggins matched some of the dark Fraunhofer lines in spectra from several stars with terrestrial substances, demonstrating that stars are made of the same earthly elements rather than exotic substances.
French astronomer Pierre-Jules-César Janssen (1824-1907) went to India to observe the 1868 total solar eclipse and to make the first spectroscopic study of the Sun's chromosphere. He noted a yellow spectral line which did not quite match Sodium or any other element. The English astronomer Sir Norman Lockyer (1836-1920) proposed that the spectral line was due to an element on the Sun, but unknown on Earth, which he proposed to call Helium after Helios, the Greek name for the Sun. Between 1888 and 1903 Helium was identified on Earth produced by Uranium ores, contained in volcanic gases, and as much as several percent of natural gas. And thus analysis of the spectra of starlight collected by telescope became an effective method of remotely analyzing the composition of distant stars.
Even before the discovery of spectra, scientists had tried to find ways to categorize stars. By observing spectra, astronomers realized that large numbers of stars exhibit a small number of distinct patterns in their spectral lines. This means of classifying stars by spectral features was quickly realized to be a powerful tool. The primary spectral classification scheme was developed at Harvard Observatory in the early 20th century by Henry Draper (1837-1882), who in 1872 made the first photograph of a stellar spectrum, that of Vega. After his death the bulk of the classification work was done by Annie Jump Cannon (1863-1941) from 1918 to 1924. Draper's original scheme used capital letters running alphabetically followed by numeric subcategories. Subsequent revisions have eliminated some lettered catagories as stellar evolution became better understood. Cannon developed the famous mnemonic Oh! Be a fine girl: Kiss me!
to help remember the order of the catagories from hottest to coldest.
| Type | Color | Approximate Surface Temperature |
Main Characteristics |
| O | Blue | >25,000 K | He1+ emission or absorption lines. Strong ultraviolet continuum. |
| B | Blue | 11,000-25,000 K | Neutral helium absorption lines. |
| A | Blue | 7,500-11,000 K | Hydrogen lines at maximum strength for A0 stars, decreasing thereafter |
| F | Blue to White | 6,000-7,500 K | Metallic lines noticeable. |
| G | White to Yellow | 5,000-6,000 K | Sun-like spectra. Absorption lines of neutral metal atoms and ions (e.g. Ca1+). |
| K | Orange to Red | 3,500-5,000 K | Metallic lines dominate. Weak blue continuum. |
| M | Red | <3,500 K | Molecular bands of TiO2 noticeable. |
Huygens estimated the distance to the nearest stars by comparing their brightness to that of the Sun as seen through a hole drilled in a disk. He found that the hole needed to be 1/28,000 the apparent diameter of the Sun. The distance between the Earth and Sun is 1.5 x 10⁸ km. Based on Huygens' measurement, how far away is a typical nearby star?


![]()
next Experiment
to ie-Physics menu
to site menu