![]()
Of all the chemical equilibria around us and within us, perhaps we are most familiar with the one for which we have a built-in tongue detector: We taste acid as sour and base as bitter. Conceptually it involves the attachment or release of Hydrogen ions, H+1, bare protons, from molecules or ions. But in the aqueous environment of our bodies and many surroundings, these protons are hydrated, surrounded by an entourage of water molecules, H2O. (While all atoms are composed of electrons, protons, and usually neutrons, the smallest atoms, Hydrogen, contain only a single tiny, massive proton inclosed inside the much lighter and thus much larger single electron. 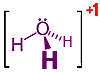 So when a Hydrogen atom is ionized by the removal of its electron, only the bare proton with positive electric charge remains. Usually a handful of water surround each proton in such a way that the excess electric charge is shared equally by all Hydrogen in the cluster. The advantage of such sharing is usually calculated as a reduction in the system's potential energy. The mathematics is similar to what encourages a ball to roll down hill. At right→ is the 3-dimensional structural formula for the simplest such sharing, what chemists call the Hydronium ion. Note that while the H+1 pulled free of its original molecule can be thought of as a bare proton, once a part of a Hydronium, all Hydrogen protons are indistinguishably identical.)
Each of the enormous number of molecules containing Hydrogen has an equilibrium for release of each hydrogen as an ion (just a proton except for the rare Hydrogen isotopes of Deuterium and Tritium which also have respectively one and two neutrons). H:molecule ↔ H+1 + molecule-1. (So Keq = [H+1]•[molecule-1] / [H:molecule].) However the covalent bonds holding Hydrogen in most organic molecules are quite strong, so Keq ≈ 0 and those Hydrogen essentially never ionize off. But in molecules with carboxyl (-COOH) functional groups as well as some inorganic molecules, the resulting ions can be stabilized by sharing the charge so that the proton can be pulled off much more readily, making Keq > 0.
The bonds holding Hydrogen in water are polar (the electron pair is not shared equally, but pulled stronger by the Oxygen) so that there is a small but significant chance of one Hydrogen being ionized: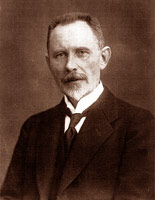 The concentration of H+1 ions in water can vary at least 14 powers of ten. So it is easier to describe their concentration using exponents. In 1909 a Danish biochemist, Søren Peder Lauritz Sørensen (b1868 - d1939, at right→) of the Carlsberg Laboratory, published a paper in which he introduced two new methods for measuring acidity, one using electrodes and the second comparing the colors of indicator chemicals. Because of the annoying difficulty of the then limited technology for typing and printing exponents, Sørensen defined what he called (in German) potenz Hydrogen (power of Hydrogen):
In pure water near room temperature, the concentration of H+1 is about 1 x 10⁻⁷ M so that the pH of the water is about +7. Consider vinegar, a much GREATER acid with concentration of H+1 perhaps 10-2 M, the pH is about +2. In household ammonia, a strong base with much LOWER concentration of H+1 nearly 10-14 M, the pH is about +14. So small differences in pH numbers represent much larger differences in H+1 concentration. Because of the negative sign in the definition of pH, a DECREASE in pH by one represents a TEN-fold INCREASE in H+1 concentration. And a LOWER pH by 3 represents 1000 ( = 103) times MORE concentration of H+1.
As mentioned above, Søren Sørensen suggested two methods for measuring acidity, one using electrodes and the other comparing chemical colors.
pH is often found electrically using a combination of two porous glass electrodes. This combination allows the measurement of the electrical potential difference between one electrode sensitive to the Hydrogen ion activity and a second reference electrode, typically a calomel electrode or a silver chloride electrode. The chemical tug-a-war for electrons is measured as Voltage.
The calomel electrode is based on the reaction between elemental Mercury and mercury(I) chloride:The electrons in all substance absorb light of discrete wavelengths and often re-emit the energy at other wavelengths. For many common substances, the absorbed and emitted colors are beyond the range of colors detected by our human eyes leaving them appearing white or colorless to us. But some substances absorb visible light resulting in their appearing colored. A few of those substances are acids or bases which have two (or more) electronic structures depending on the acidity of their environment. Such substances are called acid-base indicators. One of the structures hold onto electrons more tightly, only absorbing light of a higher frequency than the other structure. Such substance can provide an easy and fast way to determine whether tie acidity of the environment is more or less than the pH at which the substance undergoes the structural change.
For example a substance extracted from lichens (especially Roccella tinctoria) called litmus conveniently changes structure when the Hydrogen ion concentration is about 10-7 M. When litmus is in alkaline conditions it strongly absorbs yellow light and therefore appears blue, the average of the colors it primarily reflects. In more acidic conditions litmus broadly absorbs green, blue and violet, appearing red. 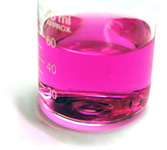 Another substance called phenolphthalein changes structure (as shown at left)
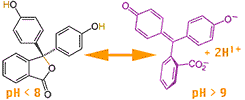 when the Hydrogen ion concentration is between 10-8 and 10-9 M. In acidic and neutral solutions it is colorless, but changes to a pink or magenta (at right→) when the pH is greater than 9. You might try to figure how 4 electron pairs (sticks) shuffle downward in the diagram when the 2 Hydrogen are pulled off. While not fully shown, the negative charge can be shared by all 4 Oxygen by such resonance of electron pairs.
It seems that humans and other animals with color vision use color to select our food. For example, a white or brown strawberry is much less appetizing than one which is bright red. Plants may have evolved to give their energy rich seed packages distinct, attractive colors so that animals would be enticed to provide beneficial transportation. Those who process and repackage food have also learned to suitably color the food.
Cheese makers have for centuries used annatto derived from the seed of a tropical tree to give cheddar its distinctive color. Carrots, powdered beets, caramel, cochineal extract, various fruit and vegetable juices, grape skins, paprika, saffron, and turmeric are all used by food makers to provide appropriate color.
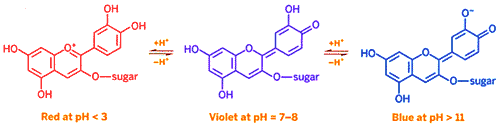
However obtaining red, green and blue is challenging because those compounds such as anthocyanins tend to be unstable and fade over time. One of the more useful anthocyanins is cyanidin which is responsible for the color of purple potatoes, red cabbage, and dark berries. Like the pH indicators described above, cyanidin changes structure when acidity varies (as the cyanidin structural formulae below show), resulting in different colors. The sugar in cyanidin is glucose.
While it is possible to purchase pH indicators, it is reasonably easy to extract natural indicators from fruits such as blueberries, blackberries, purple grapes, flowers such as rose petals and leaves such as purple cabbage. While you might want to experiment with some of other indicators, the directions below explain how to obtain a low cost natural indicator. The procedure that follows will extract anthocyanin pigments from the purple cabbage leaves to serve as indicators of pH changes. But the procedure could be used to extract other natural indicators as well.
In general such an experiment as this involves three stages: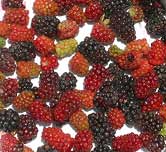 several red cabbage leaves (or equivalent of flower petals, blue berries, purple grapes, or blackberries. Shown at right is a mix of immature and ripe blackberries used to make the sample chart shown in Step II below.)
The concept used in this procedure is to determine the colors of the pigment when a small amount is mixed in each of a series of water solutions of various known pH. Colored substances selectively absorb a portion of incident light, reflecting (or transmitting) the remaining which constitutes their apparent color. Each indicator molecule typically appears one color a bit above a specific pH and a second color a bit below that pH. In a solution close to that specific pH the indicator exists as a mixture of the two colored forms, resulting in an intermediate color. The actual color of the mixture depends on the relative proportions of the two forms as well as the composition of the incident light. (For example, Litmus is an indicator derived from lichens. Around pH 7 it reacts with H+ ions changing form and resulting in a color change. In more acidic solutions it absorbs a Hydrogen ion appearing red when illuminated by white (all colors) light. In more alkaline (basic) solutions it releases the Hydrogen ion appearing blue in color. It is an intermediate color at pH 7. Because Litmus changed color at pH 7, it is has been used for distinguishing acids and bases for centuries. As perhaps the best known indicator, the term litmus test is now often loosely used for any clearly distinguishing tool!)
Many plants contain a combination of several colored pigments each of which changes colors at at different pH values. Thus, unlike solutions made with a single indicator, these natural indicators often change to a variety of different colors over a broad range of H+ concentrations.
Once we know the indicator's color at various H+ concentrations, small amounts of indicator can be added to solutions of unknown concentrations to provide useful information. Generally a single indicator will only reveal if the H+ concentration is above or below the pH at which the indicator changes color, unless we are lucky and the pH is within the narrow range where the indicator is a mix of its two colors. To determine more about the H+ concentration, we usually need a number of indicators either for separate tests, or mixed together providing a color remaining after the light absorption of all the indicators present. Consider the indicators A and B shown below: If indicator A is placed in an unknown liquid and appears blue, we can conclude the pH > 7. But if both indicators are added and the liquid is blue, we know 7 < pH < 9.
| Reagent | Preparation | pH | blackberry indicator colors |
| battery acid (not needed?) | vehicle Lead storage battery ESSENTIAL: wear goggles! | 0.1 | |
| lemon juice | fresh squeezed or bottled Caution: remember goggles | 2.3 | |
| white vinegar | Use full strength; Caution: remember goggles | 2.5 | |
| aspirin | 2 tables in several mL water (cloudy) | 2.7 | |
| soda, carbonated beverage | originally pale yellow | 3.0 | |
| saliva | avoid obtaining immediately after eating/drinking | 6.3 | |
| milk | (cloudy; presumably a clear solution would appear darker) | 6.8 | |
| tap water | poor choice! lack of buffer allows significant pH error | 7 ? ? | |
| egg white | raw; separate from yoke | 7.8 | |
| baking soda | teaspoon (2 cm3) dissolved in several mL water | 7.9 | |
| borax | teaspoon (2 cm3) dissolved in several mL water | 9.2 | |
| cleaner with ammonia | full strength goggles prudent | 9.7 | |
| milk of magnesia ( not need?) | commercial (cloudy) goggles prudent | 10.5? | |
| household ammonia (not need?) | Use full strength; Caution: remember goggles | 11.6 | ? |
| lye (not need?) | white drain/oven cleaner; ESSENTIAL: wear goggles! | 12-14 | ? |
Record your procedure and observations in your journal along with any analysis and conclusions which seemed appropriate. If you need course credit, use your observations to construct a formal report.
![]()
to next experiment: Corrosion
to menu for Nanochemistry, Colloidal & Physical Chemistry
to ie-Chemistry menu
to site menu